 English
  Deutsch
  Español
  Italiano
  Български
  简体中文
简体中文  Polski
  Nederlands
  Dansk
Dansk  Svenska
  Français
  Português
  Ελληνικά
  Català
  Română
  Suomi
Suomi  Čeština
  Magyar
news
2025 Accessibility Report: European eCommerce
See how Europe's top 500 eCommerce sites perform against WCAG 2.2 and the European Accessibility Act — top performers, regional benchmarks, and weak points.
About this study
In the summer of 2025, the accessibility team at QualiBooth conducted an in-depth digital accessibility audit of the top 500 eCommerce websites in Europe.
The purpose was to provide objective insights, comparative benchmarks, and guidance for organizations striving to create more inclusive digital experiences. Our study identified top-performing retailers and best practices — and these are the results.
Top European eCommerce websites by accessibility score
| Rank | Company | Country | Accessibility score |
|---|---|---|---|
| 1 | On Running | Switzerland | 100 |
| 2 | Ikea | Sweden | 99 |
| 3 | Mango | Spain | 98 |
| 4 | Sports Direct | United Kingdom | 97 |
| 5 | Bonprix | Germany | 97 |
| 6 | John Lewis | United Kingdom | 96 |
| 7 | Very | United Kingdom | 96 |
| 8 | Baur | Germany | 96 |
| 9 | Asos | United Kingdom | 95 |
| 10 | Leroy Merlin | France | 95 |
| 11 | Morrisons | United Kingdom | 95 |
| 12 | Marks & Spencer | United Kingdom | 95 |
| 13 | Dell | US & Ireland | 94 |
| 14 | H&M | Sweden | 93 |
| 15 | Alternate | Germany | 91 |
| 16 | DocMorris | Germany | 90 |
| 17 | Rewe | Germany | 86 |
| 18 | Next | United Kingdom | 86 |
| 19 | Jumbo | Netherlands | 82 |
| 20 | Apple | US & Ireland | 82 |
| 21 | Asda | United Kingdom | 81 |
| 22 | Auchan | France | 80 |
| 23 | Argos | United Kingdom | 79 |
| 24 | Carrefour | France | 78 |
| 25 | Zalando | Germany | 77 |
| 26 | Wilko | United Kingdom | 76 |
| 27 | Ebay | US & Ireland | 74 |
| 28 | Phone House | Spain | 74 |
| 29 | Zara | Spain | 74 |
| 30 | Sainsbury’s | United Kingdom | 74 |
| 31 | Nike | US & Netherlands | 74 |
| 32 | Currys | United Kingdom | 74 |
| 33 | Coopérative U | France | 73 |
| 34 | Amazon | US & Luxembourg | 72 |
| 35 | Darty | France | 72 |
| 36 | Decathlon | France | 71 |
| 37 | MediaMarkt | Germany | 70 |
| 38 | Adidas | Germany | 68 |
Average accessibility score from 0–100 after extensive testing of Europe’s top 500 online retailers using QualiBooth’s Accessibility Toolkit. Last update: 19 June 2025.
Accessibility scores reflect performance at the time of testing and may vary over time and context. All websites were tested independently, without financial or commercial relationships influencing the process. Inclusion in this study should not be interpreted as an endorsement or indication of affiliation with QualiBooth.
Introduction and key findings
The QualiBooth accessibility team audited the top 500 eCommerce websites in Europe, assigning each a score from 0 to 100. Scores were based on automated scans, manual testing, and user interviews to reflect real-world usability for people with disabilities. Higher scores indicate stronger alignment with the Web Content Accessibility Guidelines (WCAG) 2.2, the global standard set by the World Wide Web Consortium (W3C).
The audits covered mission-critical user flows, including the desktop and mobile versions of:
- Homepages
- Product listing and detail pages
- Cart and checkout processes
What highly accessible websites had in common
- Logical information architecture — clear heading structures, HTML landmarks, and intuitive menu navigation.
- Robust keyboard operability — the most accessible sites allowed users to complete all core journeys, from navigation to checkout, using only a keyboard.
- Strong visual accessibility — appropriate use of alternative text for images, sufficient color contrast, and scalable, readable typography.
- Flawless form usability — clear labels, helpful error messaging, and consistent, predictable design.
- Mobile-first design — accessibility scores were, on average, 15% higher for websites built with a mobile-first approach.
Persistent areas of weakness
- Dynamic and interactive content — carousels, modal windows, and persistent navigation bars sometimes interfere with keyboard focus or trap screen-reader users.
- Multimedia accessibility — captions, transcripts, and audio descriptions are inconsistently implemented across video and audio content.
- Authentication processes — CAPTCHAs and cognitively demanding password reset flows remain common, contrary to WCAG 2.2 standards.
- Cross-platform consistency — desktop experiences often present accessibility regressions compared with mobile environments.
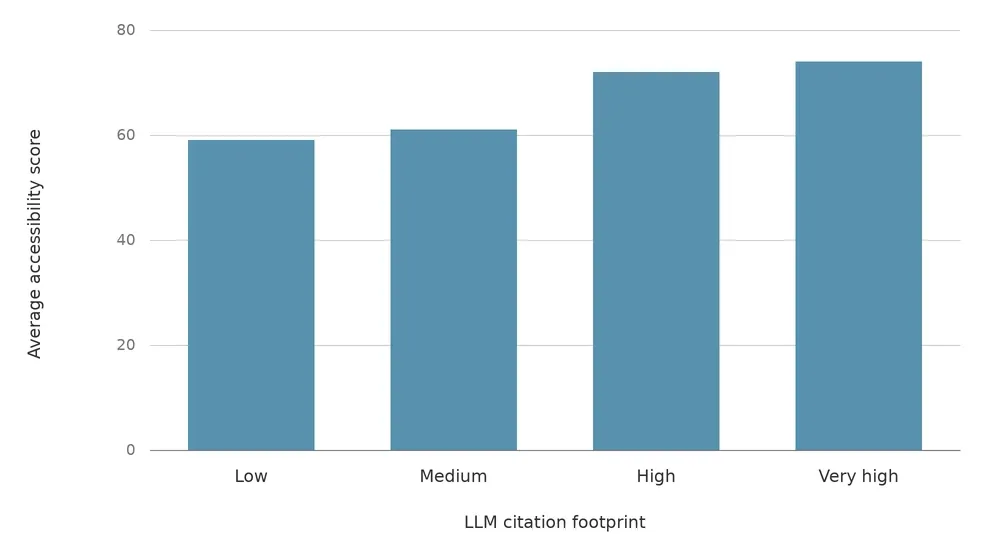
- Large Language Model (LLM) visibility — the relationship between WCAG compliance and LLM visibility is clear, and organizations who embrace accessibility standards will benefit from an increased citation footprint.
Headline findings
- Norway (77), the United Kingdom (75), and Ireland (71) on average had the highest accessibility scores.
- Despite some outstanding individual performers, France (64), Spain (63), and Germany (57) generally lagged behind.
- Home and garden (73), food and drink (64), and general shopping websites (63) generally score higher than sectors such as pets (56) or arts and entertainment (47).
- Websites in the automotive and industrial verticals on average rank lowest (43 and 36 respectively).
- The choice of eCommerce platform has no direct impact on accessibility scores.
- Accessibility scores were highest for homepages (73) and lowest for product listing pages (60).
The findings underscore that while achieving a strong accessibility score is possible for large, complex eCommerce websites, accessibility remains an iterative process requiring ongoing monitoring and remediation. With the enforcement of the European Accessibility Act as of June 2025, organizations operating in the European digital market must demonstrate a proactive and systematic approach to accessibility. Failure to do so exposes them to legal, reputational, and financial risks.
External studies consistently show that poor accessibility — particularly in forms and checkout processes — leads to higher abandonment rates. Enhancing accessibility in these areas is not only a compliance priority but also a proven driver of improved conversion and customer retention.
Key supporting studies include:
- Forrester Research (Microsoft): 69% of customers with accessibility needs will abandon inaccessible sites.
- Baymard Institute (2023): checkout form usability and accessibility are top drivers of cart abandonment.
- Click-Away Pound Survey (UK, 2021): 73% of users with disabilities have abandoned a site due to accessibility barriers.
- W3C/WAI case studies: businesses, including large eCommerce properties, have reported increased conversion rates after improving accessibility.
Methodology
Scope of analysis
The study evaluates 500 of the top European eCommerce websites, based on extensive testing against current WCAG 2.2 criteria. The analysis, conducted from April to June 2025, involved manual and automated testing methods using QualiBooth’s accessibility testing software. It highlights both areas of excellence and persisting challenges, with implications for compliance under the European Accessibility Act (EAA).
Each website was evaluated through interviews, automated scans, and manual tests, resulting in an accessibility score from 0 to 100 that reflects its real-world usability for people with disabilities. The audit included the desktop and mobile versions of homepages, product listing pages, product detail pages, and cart and checkout flows.
Both automated and guided scores were derived from QualiBooth’s accessibility testing platform, Agora, to ensure consistency. The testing evaluated compliance with WCAG 2.2 standards.
- For automated scans, URLs were provided to the tool and scanned without human intervention.
- For guided scans, accessibility professionals navigated the same URLs, scrolling through each page to ensure full content load — including lazy loading, dynamically loaded elements, cookie notices, modal windows, and CAPTCHAs.
- Pages that were blocked from software scans or were unavailable for technical reasons were marked as N/A.
Scoring mechanism
Pages started with a score of 100, with deductions based on issue count and severity. Human-guided scans typically exposed more content, often producing slightly lower scores than automated scans.
| Score | Interpretation |
|---|---|
| Over 85 | High and commendable — few accessibility problems |
| 60 to 84 | Partial compliance — areas for improvement remain |
| Under 60 | Low — significant accessibility issues |
This software-based testing provides an automated assessment against WCAG 2.2 standards. A score of 100 in this report does not imply that a site is 100% accessible, nor does a score of 100 imply 100% compliance.
Complete accessibility evaluation requires:
- Software-based testing to efficiently detect common issues.
- A full manual audit by a trained professional to assess nuances such as context, usability, cognitive load, and assistive technology compatibility that cannot be fully evaluated through automation alone.
Top performers and emerging trends
Strengths among top performers
Our study identified top-performing retailers, some of whom achieved remarkable accessibility scores of 95 and above — On Running, IKEA, Mango, Sports Direct, and Bonprix among them.
These tests were run externally, and for the purposes of this study the accessibility team at QualiBooth had to make assumptions based upon markers observed on the pages tested. Based on our analysis, these sites achieve consistently high accessibility scores in part due to:
- Information architecture and navigation — clear use of headings, landmarks, and logical menu structures that enhance screen reader compatibility.
- Keyboard operability — core user journeys (homepage navigation, product search, and checkout) are accessible without reliance on a mouse.
- Visual accessibility — appropriate use of text alternatives, high color contrast ratios, and scalable typography.
- Form usability — well-labeled input fields, accessible error messaging, and consistent form design.
- Mobile optimization — increasing adoption of touch-friendly design aligning with WCAG 2.2 standards.
High-performing organizations go well beyond clean code. Based on our qualitative interviews, several additional best practices emerge:
- High performers treat accessibility as a cultural and strategic priority, not merely a technical requirement. They embed accessibility into their corporate social responsibility (CSR) and mission statements, holding themselves accountable to long-term roadmaps. Leadership commitment is key: many appoint senior executives with responsibility for accessibility across physical and digital environments, who then establish dedicated teams or squads to drive progress.
- High performers acknowledge the risk of unconscious bias and proactively mitigate it by combining automated testing with manual reviews to uncover and correct barriers. They recognize that accessibility must be built in “by design,” balancing business objectives with the ethical and regulatory imperative of inclusion.
- High performers integrate accessibility testing directly into development workflows. This, they say, ensures that compliance is not an afterthought, but a continuous, measurable process.
The product detail pages of On Running’s desktop and mobile experiences scored a perfect 100 accessibility score when tested against WCAG 2.2 standards. The score was determined with automated scans and confirmed with a manual audit of the same pages.
Persistent areas of weakness
Even leading retailers show vulnerabilities in more complex areas:
- Dynamic and interactive content — carousels, modal windows, and persistent navigation bars sometimes interfere with keyboard focus or trap users.
- Multimedia accessibility — captions, transcripts, and audio descriptions are inconsistently implemented across video and audio content.
- Authentication processes — as some content delivery networks tighten restrictions on LLM access, we are seeing a resurgence of cumbersome authentication pages, contrary to WCAG 2.2 standards.
- Cross-platform consistency — mobile experiences often present accessibility regressions compared with desktop environments.
- External partner accountability — certain external partners such as agencies or contractors are sometimes not held to the same accessibility standards as internal teams.
- Organizational management — a single “accessibility champion” isn’t enough. Top-performing organizations had a central QA function with authority, and a culture where every team member, internal or external, takes responsibility for accessibility.
Interactive controls such as dropdown menus that are not nested are often an issue and cause focus problems for assistive technologies.
National and sectoral differences
National differences
When assessing average accessibility scores by country, our study revealed significant discrepancies. What stood out was a strong correlation between Human Development Indicators (HDIs) and digital accessibility scores, suggesting a link between economic development, consumer protection, and institutional governance.
| Rank | Country | Accessibility score |
|---|---|---|
| 1 | Norway | 77 |
| 2 | United Kingdom | 75 |
| 3 | Ireland | 71 |
| 4 | Austria | 69 |
| 5 | Italy | 67 |
| 6 | Netherlands | 66 |
| 7 | Sweden | 65 |
| 8 | France | 64 |
| 9 | Finland | 63 |
| 10 | Belgium | 63 |
| 11 | Denmark | 63 |
| 12 | Spain | 63 |
| — | European average | 62 |
| 13 | Hungary | 61 |
| 14 | Slovenia | 60 |
| 15 | Portugal | 59 |
| 16 | Czech Republic | 58 |
| 17 | Poland | 57 |
| 18 | Germany | 57 |
| 19 | Bulgaria | 50 |
| 20 | Greece | 47 |
| 21 | Romania | 45 |
Accessibility statement coverage
Accessibility statements are public declarations outlining a website’s commitment to digital inclusion, its level of conformance with accessibility standards, and how users can report issues or request accommodations. While accessibility statements are legally required for most public-sector websites and, from June 2025, many private-sector services in the EU under the European Accessibility Act, they are increasingly seen as a best practice worldwide.
| Rank | Country | Accessibility statement coverage |
|---|---|---|
| 1 | United Kingdom | 67% |
| 2 | France | 65% |
| 3 | Ireland | 42% |
| 4 | Belgium | 36% |
| 5 | Norway | 34% |
| 6 | Austria | 33% |
| 7 | Spain | 32% |
| 8 | Denmark | 31% |
| 9 | Italy | 31% |
| — | European average | 30% |
| 11 | Germany | 29% |
| 12 | Sweden | 27% |
| 13 | Netherlands | 24% |
| 14 | Slovenia | 24% |
| 15 | Portugal | 23% |
| 16 | Finland | 21% |
| 17 | Poland | 19% |
| 18 | Greece | 11% |
| 19 | Hungary | 11% |
| 20 | Czech Republic | 10% |
| 21 | Romania | 6% |
| 22 | Bulgaria | 4% |
The Body Shop is a great example of digital accessibility, clearly displaying accessibility statements on its online stores.
Sectoral differences
When it came to scoring brands by vertical industry, our study revealed that home and garden, food and drink, and general shopping websites ranked comparatively higher than sectors such as health, fitness, style, and fashion. Websites in the business and industrial verticals ranked lowest in terms of accessibility, in part due to more complex purchasing workflows.
Our study also highlights how international technology companies tend to perform well but not at the top tier. This suggests that scale and technological sophistication do not necessarily translate into superior accessibility outcomes.
| Industry vertical | Accessibility score |
|---|---|
| Home and garden | 73 |
| Sports | 65 |
| Food and drink | 64 |
| Shopping | 63 |
| European average | 62 |
| Hobbies and interests | 61 |
| Technology and computing | 61 |
| Health and fitness | 60 |
| Style and fashion | 60 |
| Pets | 56 |
| Art and entertainment | 47 |
| Automotive and vehicles | 43 |
| Business and industrial | 36 |
Low- and medium-performing websites tend to apply accessibility selectively rather than embed it across the digital experience. Generally, these websites:
- Provide basic alt text on product images.
- Offer captioning on some videos, though often auto-generated and not accurate.
- Maintain mobile responsiveness, but without fully considering accessibility needs like large touch targets.
- Link an accessibility statement — though often generic, outdated, or incomplete.
We also noted that low performers tend to have websites with:
- Inconsistent alt text — either missing entirely, automatically generated, or unhelpful (e.g. “image123.jpg”).
- Poor color contrast — stylish designs that prioritize branding over readability, such as light gray text on white backgrounds.
- Keyboard traps — interactive elements (menus, modals, carousels) that can’t be reached or exited using only the keyboard.
- Forms without proper labels — fields lacking clear instructions, vague error messages, and required inputs that are not announced to screen readers.
- Over-reliance on automation — overlays and widgets that give a false sense of compliance but don’t address underlying code issues.
- Dynamic content without ARIA support — pop-ups, sliders, and dropdowns that aren’t properly announced by assistive technologies.
- Non-structured HTML — skipped heading levels, improper nesting, or excessive divs, making navigation confusing for screen readers.
Country and regional rankings
Top 10 sites in the United Kingdom
John Lewis’ site scored particularly high on their product listing and detail pages. Their checkout experience was also top par.
| Rank | Store | Accessibility score |
|---|---|---|
| 1 | johnlewis.com | 96 |
| 2 | very.co.uk | 96 |
| 3 | asos.com | 95 |
| 4 | morrisons.com | 95 |
| 5 | marksandspencer.com | 95 |
| 6 | ikea.com | 92 |
| 7 | apple.com | 87 |
| 8 | next.co.uk | 86 |
| 9 | asda.com | 81 |
| 10 | argos.co.uk | 79 |
Top 10 sites in Germany
Modal windows do not impact bonprix’s accessibility experience, demonstrating that great user experience need not be achieved at the expense of digital accessibility.
| Rank | Store | Accessibility score |
|---|---|---|
| 1 | bonprix.de | 97 |
| 2 | baur.de | 96 |
| 3 | alternate.de | 91 |
| 4 | docmorris.de | 90 |
| 5 | rewe.de | 86 |
| 6 | hm.com | 81 |
| 7 | ikea.com | 81 |
| 8 | zalando.de | 77 |
| 9 | apple.com | 75 |
| 10 | mediamarkt.de | 70 |
Top 10 sites in France
Leroy Merlin is an example of a highly accessible website with strong keyboard navigation and dynamic content management.
| Rank | Store | Accessibility score |
|---|---|---|
| 1 | leroymerlin.fr | 95 |
| 2 | ikea.com | 95 |
| 3 | asos.com | 95 |
| 4 | apple.com | 89 |
| 5 | zalando.fr | 83 |
| 6 | zara.com | 82 |
| 7 | auchan.fr | 80 |
| 8 | carrefour.fr | 78 |
| 9 | nike.com | 73 |
| 10 | coursesu.com | 73 |
Top sites in the Nordics
Finland’s Prisma, Sweden’s CDON, and Norway’s XXL all received exceptionally high accessibility scores, an achievement attributed to incorporating accessibility design and testing in all of their development workflows.
| Rank | Store | Country | Accessibility score |
|---|---|---|---|
| 1 | ikea.com | Norway | 99 |
| 2 | ikea.com | Finland | 99 |
| 3 | prisma.fi | Finland | 98 |
| 4 | cdon.se | Sweden | 98 |
| 5 | xxl.no | Norway | 98 |
| 6 | ikea.com | Denmark | 98 |
| 7 | k-ruoka.fi | Finland | 97 |
| 8 | oda.no | Norway | 96 |
| 9 | ikea.com | Sweden | 95 |
| 10 | apotek1.no | Norway | 92 |
Top sites in Spain
The mobile and desktop versions of Mango’s website performed well throughout manual and automated tests.
| Rank | Store | Accessibility score |
|---|---|---|
| 1 | ikea.com | 98 |
| 2 | mango.com | 98 |
| 3 | alcampo.es | 94 |
| 4 | leroymerlin.es | 88 |
| 5 | asus.com | 86 |
| 6 | hm.com | 84 |
| 7 | decathlon.es | 76 |
| 8 | phonehouse.es | 74 |
| 9 | zara.com | 74 |
| 10 | mediamarkt.es | 74 |
Top sites in Italy
The Italian version of Asos’ website is particularly well designed for users with visual disabilities. Landmark elements are clear and numbers in forms are properly formatted for screen readers.
| Rank | Store | Accessibility score |
|---|---|---|
| 1 | leroymerlin.it | 99 |
| 2 | ikea.com | 96 |
| 3 | asos.com | 95 |
| 4 | qvc.it | 93 |
| 5 | bonprix.it | 93 |
| 6 | decathlon.it | 93 |
| 7 | unieuro.it | 87 |
| 8 | zalando.it | 86 |
| 9 | apple.com | 80 |
| 10 | zara.com | 77 |
Accessibility scores by global revenue
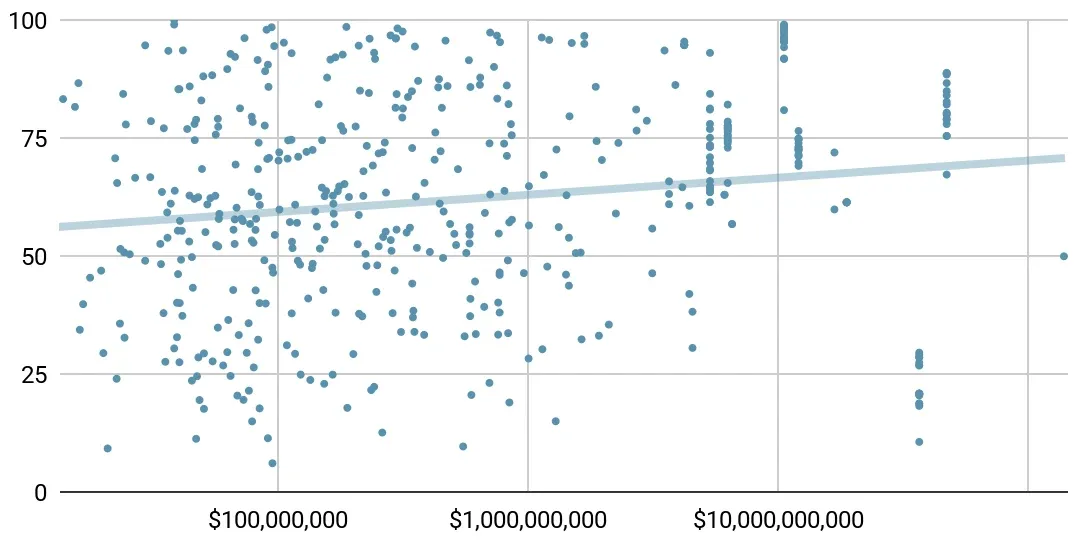
Our study reveals that — when it comes to accessibility — size is not an indicator. Websites with large global revenues do not necessarily exhibit higher accessibility scores than smaller sites. This may be partially explained by the fact that the larger a website, the more complex it tends to be and hence the more difficult it is to maintain from an accessibility perspective. In addition, some sites over-optimize by cluttering the keyboard navigation flow with aggressive cross-sell, upsell, and review prompts. Across the full range — from roughly $10 million to over $100 billion in annual revenue — the trend line rises only from about 56 to 71, and both high and low scorers appear at every revenue level.
Accessibility scores by eCommerce platform
While our data indicates that the choice of eCommerce platform has no major impact on accessibility scores, our study nonetheless denotes minor differences. For example, sites powered by Squarespace (96) and TotalOne (90) achieve very high accessibility scores, while sites built on Intershop (48), PrestaShop (38), and Scayle (31) tend to have lower accessibility scores. However, this difference is mitigated when controlling for other factors such as industry vertical and regional differences.
Differences in accessibility performance can be attributed to several factors:
- A reliance on templates — these vary widely depending on whether they are designed with accessibility in mind.
- The total cost of ownership of eCommerce platforms — higher-cost solutions often correlate with greater investment in development, product, and UX/UI resources, while lower-cost platforms may indicate fewer resources for accessibility initiatives.
- Home-grown and headless come at a cost — websites built on homegrown, headless, or composable platforms tend to score below average, suggesting that organizations using these architectures must exercise greater diligence to ensure compliance and inclusivity.
| eCommerce platform | Accessibility score |
|---|---|
| Squarespace | 96 |
| TotalOne | 90 |
| Oracle Commerce | 80 |
| Salesforce Commerce Cloud | 79 |
| BigCommerce | 76 |
| Sylius | 73 |
| Drupal Commerce | 68 |
| Shopify Plus | 68 |
| HCL Commerce | 67 |
| SAP Commerce Cloud | 66 |
| Magento | 64 |
| Average | 64 |
| Grand total | 62 |
| Home Grown | 60 |
| commercetools | 55 |
| IdoSell | 50 |
| Intershop | 48 |
| PrestaShop | 38 |
| Scayle | 31 |
High-performing websites typically integrate accessibility testing into their eCommerce platform’s workflows (e.g. Oracle Commerce) and provide templates that have been vetted for compliance with accessibility standards.
By contrast, websites can fall short when heavy customization prioritizes branding over accessibility, such as rigid color schemes that limit contrast or design flexibility. Accessibility can also be compromised through reliance on third-party integrations — such as social media widgets or customer review tools — that are not optimized for inclusivity.
Accessibility scores by critical touchpoint
Product listing pages
These pages display filtered product categories (like women’s running shoes) in a clear hierarchy: product image, name, color options, and price. Key accessibility requirements include logical navigation flow between elements and properly labeled filter and sort controls.
Product detail pages
Critical for conversion, these pages must guide users seamlessly through the decision-to-purchase flow — for example: product details → size/availability selection → add to cart → cart confirmation. Tab order should follow this logical sequence, ensuring users can efficiently navigate the purchasing path without confusion.
Shopping carts and checkout
Cart pages should minimize distractions and follow an intuitive tab order — for example: cart contents → quantity adjustments → proceed to checkout. During checkout, focus on essential elements only; avoid special offers or promotional content that disrupts the completion flow. Design for keyboard navigation to ensure accessibility across all input methods.
Mobile experiences
Mobile sites typically achieve higher accessibility scores than their desktop counterparts due to inherent design constraints that favor accessibility principles. The streamlined mobile experience — with simplified navigation, minimized filter options, and reduced visual complexity — naturally creates clearer user pathways and better focus management.
Organizations adopting mobile-first design approaches often see improved accessibility scores across all platforms, as the constraints of mobile development encourage cleaner information hierarchies and more intentional user interface decisions.
Accessibility scores and LLM visibility
The final part of our research examined the relationship between accessibility scores and visibility in LLMs like ChatGPT, Claude, and Gemini. To measure visibility, we used a proxy called citation footprint — the degree to which a website domain is represented, referenced, or recallable by an LLM.
When looking at citation footprint, LLMs typically take into account several factors:
- Presence in training data — was text from or about the site widely available and used in the pretraining corpus?
- Domain authority and backlinks — websites with strong SEO and lots of inbound links are more likely to appear in crawled datasets.
- Topical prominence — is the domain a go-to reference in its industry (e.g. nike.com for sports shoes, apple.com for tech products)?
- Language and geography — some domains may have high recall in their home country or language but little global visibility.
- Temporal relevance — did the site exist and publish content before the model’s knowledge cut-off?
We analyzed the correlation between website accessibility scores and LLM visibility by running study domains through ChatGPT, Claude, and Gemini. The results revealed a striking pattern: websites with higher accessibility scores consistently showed greater visibility in LLMs.
While this correlation does not prove causation, the relationship is clear and significant. Further statistical analysis would be needed to determine the precise nature and strength of this accessibility–LLM visibility connection.
Conclusion
Challenges to accessibility compliance often stem from failure to include accessibility features in template designs, a lack of integration with common web development workflows, and the absence of real-time monitoring.
QualiBooth’s powerful suite of digital accessibility tools respects your brand identity and maximizes team efficiency, enabling you to increase realizable market size. To gain insights about how well your website follows WCAG 2.2 criteria, start with a baseline scan using QualiBooth’s free accessibility scanner. The findings noted by the scanner will illuminate high-impact issues so that you can prioritize fixes based on page views and user traffic, not just total issue count.
Furthermore, to achieve a highly accessible website, our study suggests that organizations should:
- Assign ownership — designate a dedicated team to lead accessibility efforts.
- Choose proactive tools — select comprehensive scanning solutions over quick-fix widgets and overlays.
- Integrate into workflows — embed accessibility testing directly into development processes.
- Educate your ecosystem — train internal teams, vendors, and agencies on accessibility requirements before projects begin.
The key is starting somewhere and building momentum through systematic improvement, recognizing that your organization can turn accessibility into an advantage.
Methodology note: Sites were assessed with automated and manual testing against WCAG 2.2 criteria. A score of 100 does not imply full accessibility — full evaluation requires manual audits by trained accessibility professionals.
Appendix A: website rankings by critical touchpoint
Product listing pages
| Rank | Country | Store | Score |
|---|---|---|---|
| 1 | Switzerland | on.com | 100 |
| 2 | United Kingdom | morrisons.com | 99 |
| 3 | United Kingdom | marksandspencer.com | 99 |
| 4 | Norway | ikea.com | 99 |
| 5 | Finland | ikea.com | 99 |
| 6 | Finland | prisma.fi | 99 |
| 7 | Sweden | cdon.se | 99 |
| 8 | Norway | xxl.no | 99 |
| 9 | Denmark | ikea.com | 99 |
| 10 | Spain | mango.com | 99 |
| 11 | Spain | alcampo.es | 99 |
| 12 | Slovenia | bauhaus.si | 99 |
| 13 | Poland | ikea.com | 99 |
| 14 | Ireland | marksandspencer.com | 99 |
| 15 | Hungary | ikea.com | 99 |
| 16 | Germany | bonprix.de | 99 |
| 17 | Austria | ikea.com | 99 |
| 18 | France | leroymerlin.fr | 99 |
| 19 | France | zara.com | 99 |
| 20 | Czech Republic | bonprix.cz | 99 |
| 21 | Finland | verkkokauppa.com | 99 |
| 22 | Italy | unieuro.it | 99 |
| 23 | Ireland | next.ie | 99 |
| 24 | Ireland | aldi.ie | 99 |
| 25 | Ireland | dell.com | 99 |
Product detail pages
| Rank | Country | Store | Score |
|---|---|---|---|
| 1 | Switzerland | on.com | 100 |
| 2 | Norway | ikea.com | 99 |
| 3 | Sweden | cdon.se | 99 |
| 4 | Spain | mango.com | 99 |
| 5 | Poland | ikea.com | 99 |
| 6 | Ireland | next.ie | 99 |
| 7 | Ireland | aldi.ie | 99 |
| 8 | Finland | k-ruoka.fi | 99 |
| 9 | Ireland | sportsdirect.com | 99 |
| 10 | Spain | ikea.com | 99 |
| 11 | Sweden | hm.com | 99 |
| 12 | Bulgaria | decathlon.bg | 99 |
| 13 | Finland | ikea.com | 99 |
| 14 | Denmark | ikea.com | 99 |
| 15 | Portugal | ikea.com | 99 |
| 16 | Finland | prisma.fi | 98 |
| 17 | Norway | xxl.no | 98 |
| 18 | Ireland | marksandspencer.com | 98 |
| 19 | Austria | 0815.at | 98 |
| 20 | Italy | ikea.com | 98 |
| 21 | United Kingdom | very.co.uk | 98 |
| 22 | Czech Republic | ikea.com | 98 |
| 23 | Sweden | ikea.com | 98 |
| 24 | United Kingdom | ikea.com | 98 |
| 25 | Germany | baur.de | 97 |
Shopping cart and checkout flows
| Rank | Country | Store | Score |
|---|---|---|---|
| 1 | Switzerland | on.com | 100 |
| 2 | United Kingdom | morrisons.com | 99 |
| 3 | United Kingdom | marksandspencer.com | 99 |
| 4 | United Kingdom | argos.co.uk | 99 |
| 5 | Norway | ikea.com | 99 |
| 6 | Finland | ikea.com | 99 |
| 7 | Finland | prisma.fi | 99 |
| 8 | Sweden | cdon.se | 99 |
| 9 | Norway | xxl.no | 99 |
| 10 | Denmark | ikea.com | 99 |
| 11 | Finland | k-ruoka.fi | 99 |
| 12 | Sweden | ikea.com | 99 |
| 13 | Sweden | clasohlson.com | 99 |
| 14 | Spain | mango.com | 99 |
| 15 | Spain | alcampo.es | 99 |
| 16 | Spain | decathlon.es | 99 |
| 17 | Slovenia | bauhaus.si | 99 |
| 18 | Slovenia | decathlon.si | 99 |
| 19 | Slovenia | mass.si | 99 |
| 20 | Portugal | ikea.com | 99 |
| 21 | Poland | ikea.com | 99 |
| 22 | Denmark | harald-nyborg.dk | 99 |
| 23 | Finland | petenkoiratarvike.com | 99 |
| 24 | Norway | meny.no | 99 |
| 25 | Denmark | zara.com | 99 |
Mobile websites
| Rank | Country | Store | Score |
|---|---|---|---|
| 1 | Switzerland | on.com | 100 |
| 2 | Norway | ikea.com | 99 |
| 3 | Finland | ikea.com | 99 |
| 4 | Finland | prisma.fi | 99 |
| 5 | Norway | xxl.no | 99 |
| 6 | Sweden | cdon.se | 99 |
| 7 | Austria | ikea.com | 99 |
| 8 | Norway | oda.com | 99 |
| 9 | Denmark | asos.com | 99 |
| 10 | Italy | asos.com | 99 |
| 11 | France | asos.com | 99 |
| 12 | Norway | oda.no | 99 |
| 13 | Poland | ikea.com | 98 |
| 14 | Finland | k-ruoka.fi | 98 |
| 15 | Spain | mango.com | 98 |
| 16 | Ireland | sportsdirect.com | 98 |
| 17 | Spain | alcampo.es | 98 |
| 18 | Germany | bonprix.de | 98 |
| 19 | Czech Republic | bonprix.cz | 98 |
| 20 | Ireland | asos.com | 98 |
| 21 | United Kingdom | asos.com | 98 |
| 22 | France | zara.com | 98 |
| 23 | Denmark | ikea.com | 97 |
| 24 | France | leroymerlin.fr | 97 |
| 25 | Austria | muenzeoesterreich.at | 97 |
Appendix B: the debate — free vs paid accessibility testing tools
Free tools like Google Lighthouse offer valuable entry points for accessibility testing but come with significant limitations and trade-offs for many organizations.
The benefits. Free tools eliminate budget barriers and integrate easily into existing workflows. Google Lighthouse, for example, runs directly in Chrome DevTools, making accessibility testing accessible to any developer. These tools effectively detect basic issues like missing alt text, color contrast problems, and structural violations — providing valuable early wins for teams beginning their accessibility journey.
The limitations. However, free automated tools typically catch only 20–30% of real accessibility issues. They miss complex interactive elements, keyboard navigation problems, and screen reader compatibility issues. Most critically, they provide point-in-time snapshots without ongoing monitoring, offer minimal fix guidance, and use scoring systems that dilute accessibility signals with other metrics like performance.
The bottom line. Free tools serve an important educational role but represent just the starting point. Organizations relying solely on these tools often discover their gaps through user complaints or legal challenges — when fixes are most expensive. Effective accessibility strategies use free tools as one component alongside specialized platforms, user testing, and continuous monitoring systems.
About QualiBooth
QualiBooth is a leader in digital accessibility solutions, partnering with major retailers, financial institutions, and public sector organizations across Europe. The company not only provides compliance tools but also actively contributes to accessibility best practices and industry standards.
Agora, the advanced version of QualiBooth’s accessibility toolkit, combines automated scanning with guided expert review workflows. Unlike basic scanners, Agora can replicate real-world browsing behaviors — including bypassing CAPTCHA blockers, exposing dynamic content, and mimicking user scrolling patterns — giving brands a holistic view of accessibility readiness that reflects actual customer experiences.
QualiBooth’s approach goes beyond compliance scoring. The toolkit empowers brands to improve usability, reduce legal risks, and enhance market inclusivity.
See how your store measures up