 English
  Deutsch
  Español
  Italiano
  Български
  简体中文
简体中文  Polski
  Nederlands
  Dansk
Dansk  Svenska
  Français
  Português
  Ελληνικά
  Català
  Română
  Suomi
Suomi  Čeština
  Magyar
Fix once, fix everywhere
Hundreds of issues. A handful of fixes.
Your header, navigation and footer appear on every page, so one broken link in them is reported on every page too. Component Grouping groups those findings by the element they were found on, so a scan run reads as the short list of components to fix - ranked by how many issues each fix removes.
- One row per element
- not one per issue, per page
- Ranked worst first
- by the issues a single fix removes
The same bug, counted on every page
Your site is built from templates. Your issue list should be too.
Every scanner reports per page, because that is where it found the problem. On a templated site that multiplies one defect by the number of pages it appears on: a cookie banner with an unlabelled button becomes four hundred findings, and the report that should tell you where to start tells you everything is urgent. Component Grouping reads the same results the other way round - by the element - because that is how your team fixes them.
What a flat issue list shows
Every finding, on every page, one row each.
- Links must have discernible text - /pricing
- Links must have discernible text - /about-us
- Links must have discernible text - /contact
- …and the same finding on 397 more pages.
What Component Grouping shows
One element, every page it fails on, every issue it has.
- footer nav a.social - 400 pages, 2 issue types, 800 issues.
- Fix it once in the footer template and all 800 are gone.
- Severity per page: 400 pages Critical, 400 pages Medium.
- Ranked against the rest of the run, so you know it comes first.
What every element card tells you
Everything you need to decide what to fix first
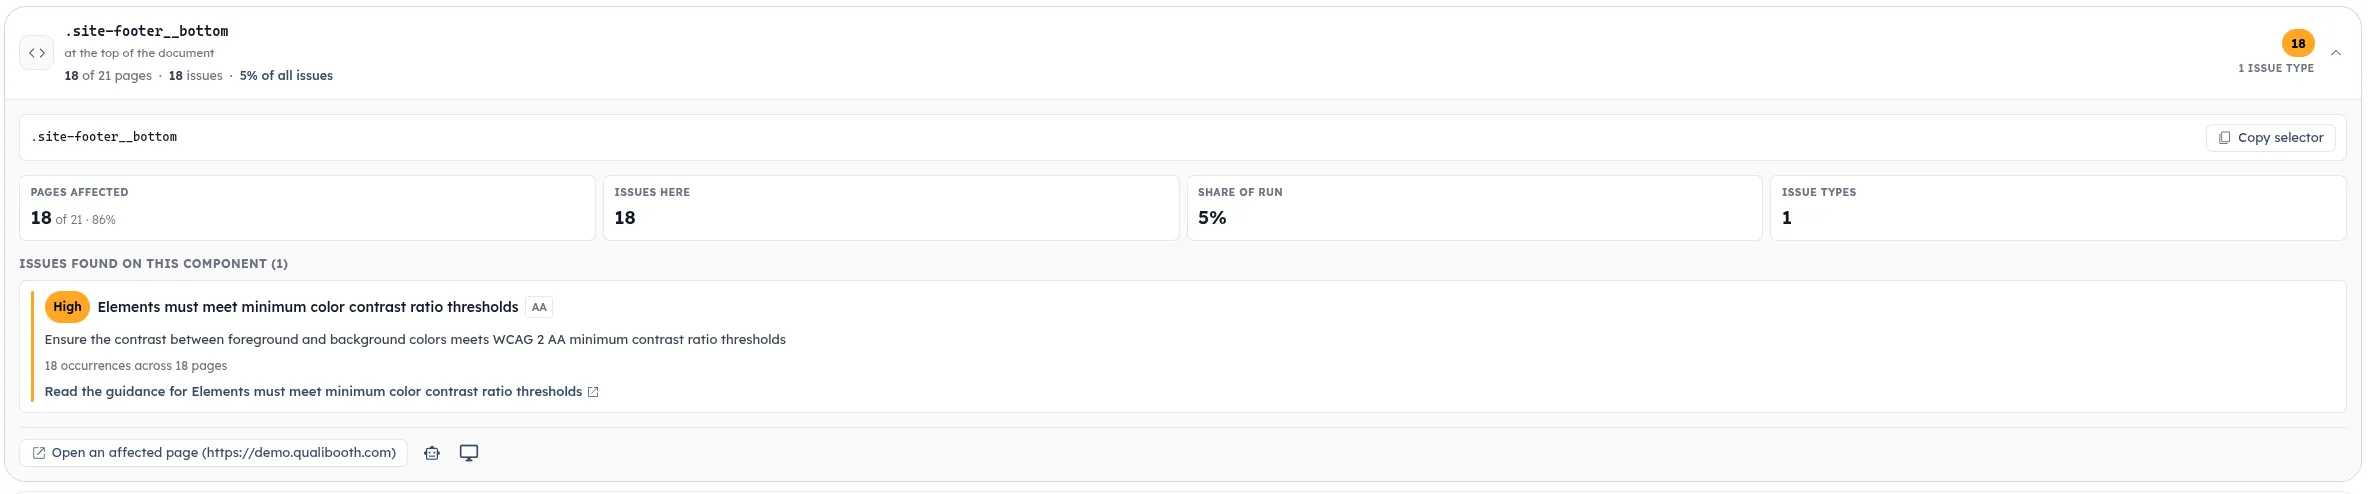
Each row is one element, not one issue. It carries every check that element fails and the figures that tell you what fixing it is worth.
- 01
Ranked by what a fix removes
Elements are ordered by the issues fixing them would remove, then by how many pages they appear on, then by severity. The top of the list is always where one change does the most.
Ranking
- 02
Pages affected, by severity
One figure per severity the element has: how many pages carry an issue at that level. A severity the element does not have is left out rather than shown as zero.
Severity
- 03
Share of the whole run
Every percentage is taken against all the issues the run found, not against what is on screen - so "12% of the run" means 12% of the run, under any filter.
Impact
- 04
Every issue on the element
The same link can fail contrast and be unlabelled - two fixes, one component. Expanding a card lists each check with its severity, WCAG level, occurrences, pages and a link to guidance on fixing it.
Detail
- 05
Filter by severity and engine
Narrow to Critical, to the findings only Deep Scan produces, or search by selector or issue name. Counts and percentages are recalculated for what is left, so the numbers always match the list.
Triage
- 06
Straight to the code
Copy the element’s CSS selector, open an affected page’s report, or open the live page in the Development Assistant or Agora with the element highlighted.
Fix
Most of a templated site’s accessibility debt lives in a few shared components. Component Grouping shows you which ones - and how much of the report each fix clears.
Numbers that add up
Figures you can put in front of a product owner
A grouped view is only useful if its numbers are right. So each one is counted, not estimated - and when a figure is a minimum rather than exact, the report says so.
- Pages are counted once per element, even when it fails several checks on different pages.
- Filtering an element rebuilds its figures from the issues left, so "Critical only" never shows totals that include minor ones.
- Issue names come from the same catalogue as the per-page report, so the same issue has the same name everywhere.
- Large runs keep the costliest elements, and the report states how many it lists out of how many it found.
The spreadsheet nobody wants to build
The triage your team does by hand after every audit - done when the scan finishes
Turning a per-page export into a list of components is not hard. It is just slow, and it has to be done again after every scan, which is why it usually is not.
-
By hand
Component Grouping
-
Export every issue to a spreadsheet
Grouped automatically when the run finishes
-
Sort by selector and collapse the duplicates
One row per element, with every check it fails
-
Count the pages each element breaks
Pages affected, per severity, on every card
-
Work out which fix clears the most
Ranked worst first by the issues each fix removes
-
Do it all again after the next release
Every scheduled run is grouped the same way
Page-specific issues stay where they are
Component Grouping lists only what fails the same way on more than one page. Everything else is still in the per-page report, and page-level findings that repeat across the site - like a missing page language - are listed as Whole page, because they are the same defect everywhere even with no component to fix.
How it works
Nothing to configure. Every scheduled scan run is grouped when it finishes.
- 01
Scan as usual
Your scheduled or on-demand scan runs exactly as before, with both the static engine and Deep Scan, on desktop and mobile.
- 02
Grouped by element
When the run finishes, QualiBooth compares every page and groups the findings that repeat on the same element, across both engines.
- 03
Ranked by what it clears
Elements are ordered by the issues fixing them would remove, and the run’s headline shows the share fixable at the component level.
- 04
Fix once, confirm it
Fix the component in your codebase. The next run shows it gone from every page it appeared on.
In your report
The first thing you see in a scan run
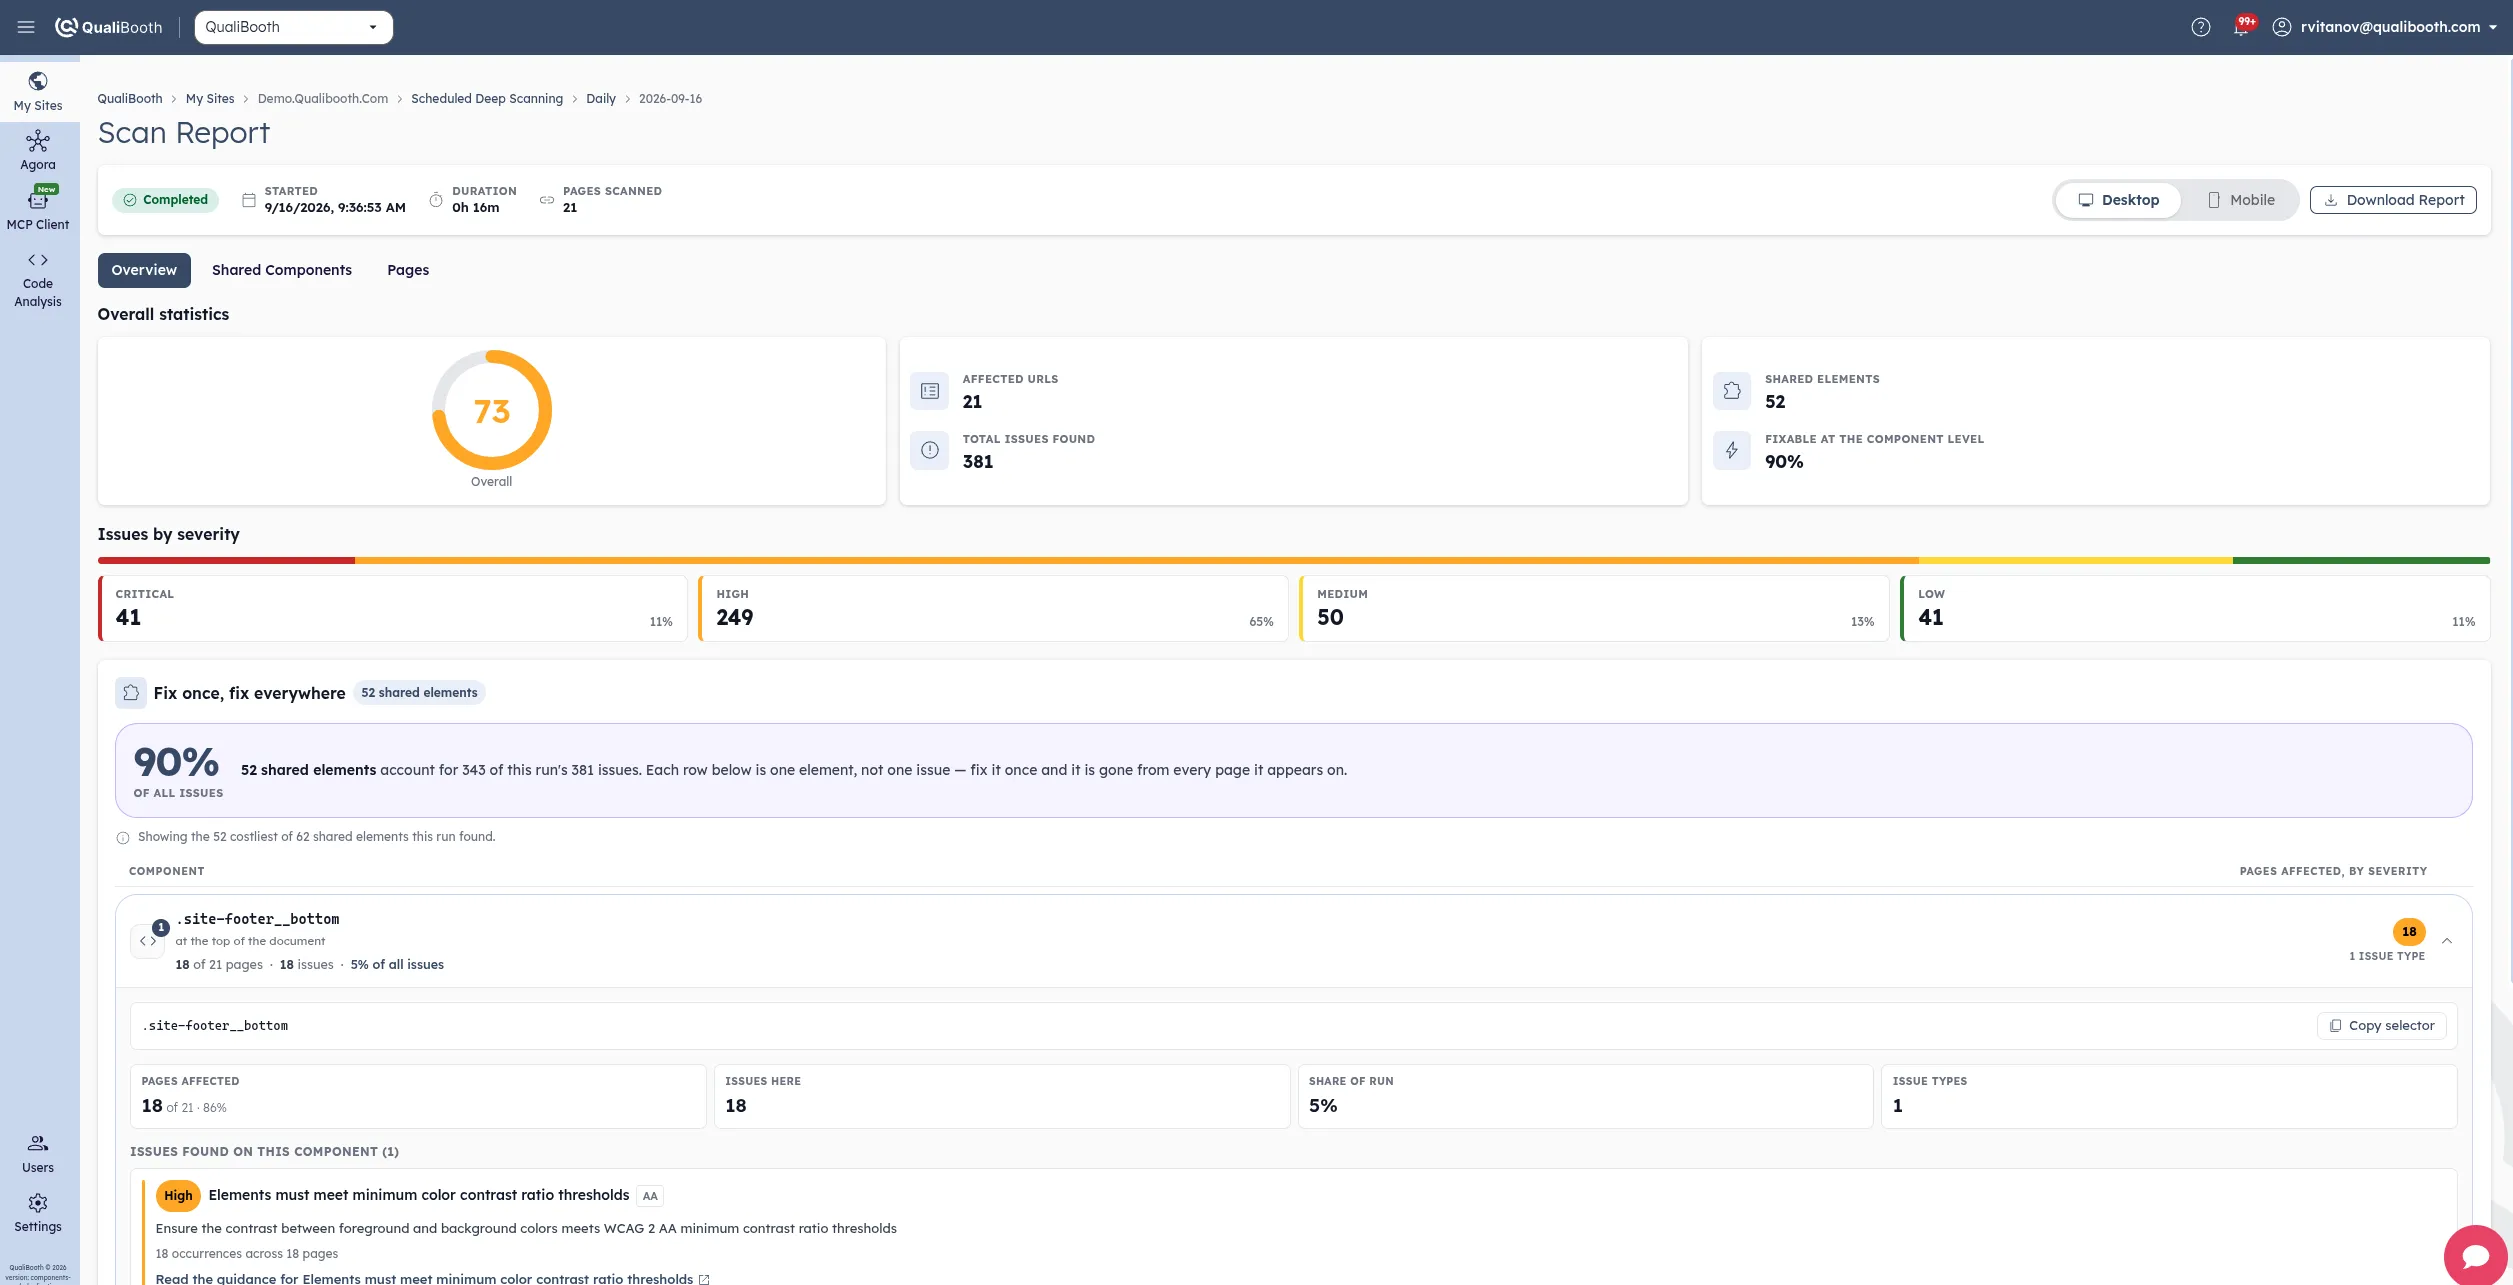
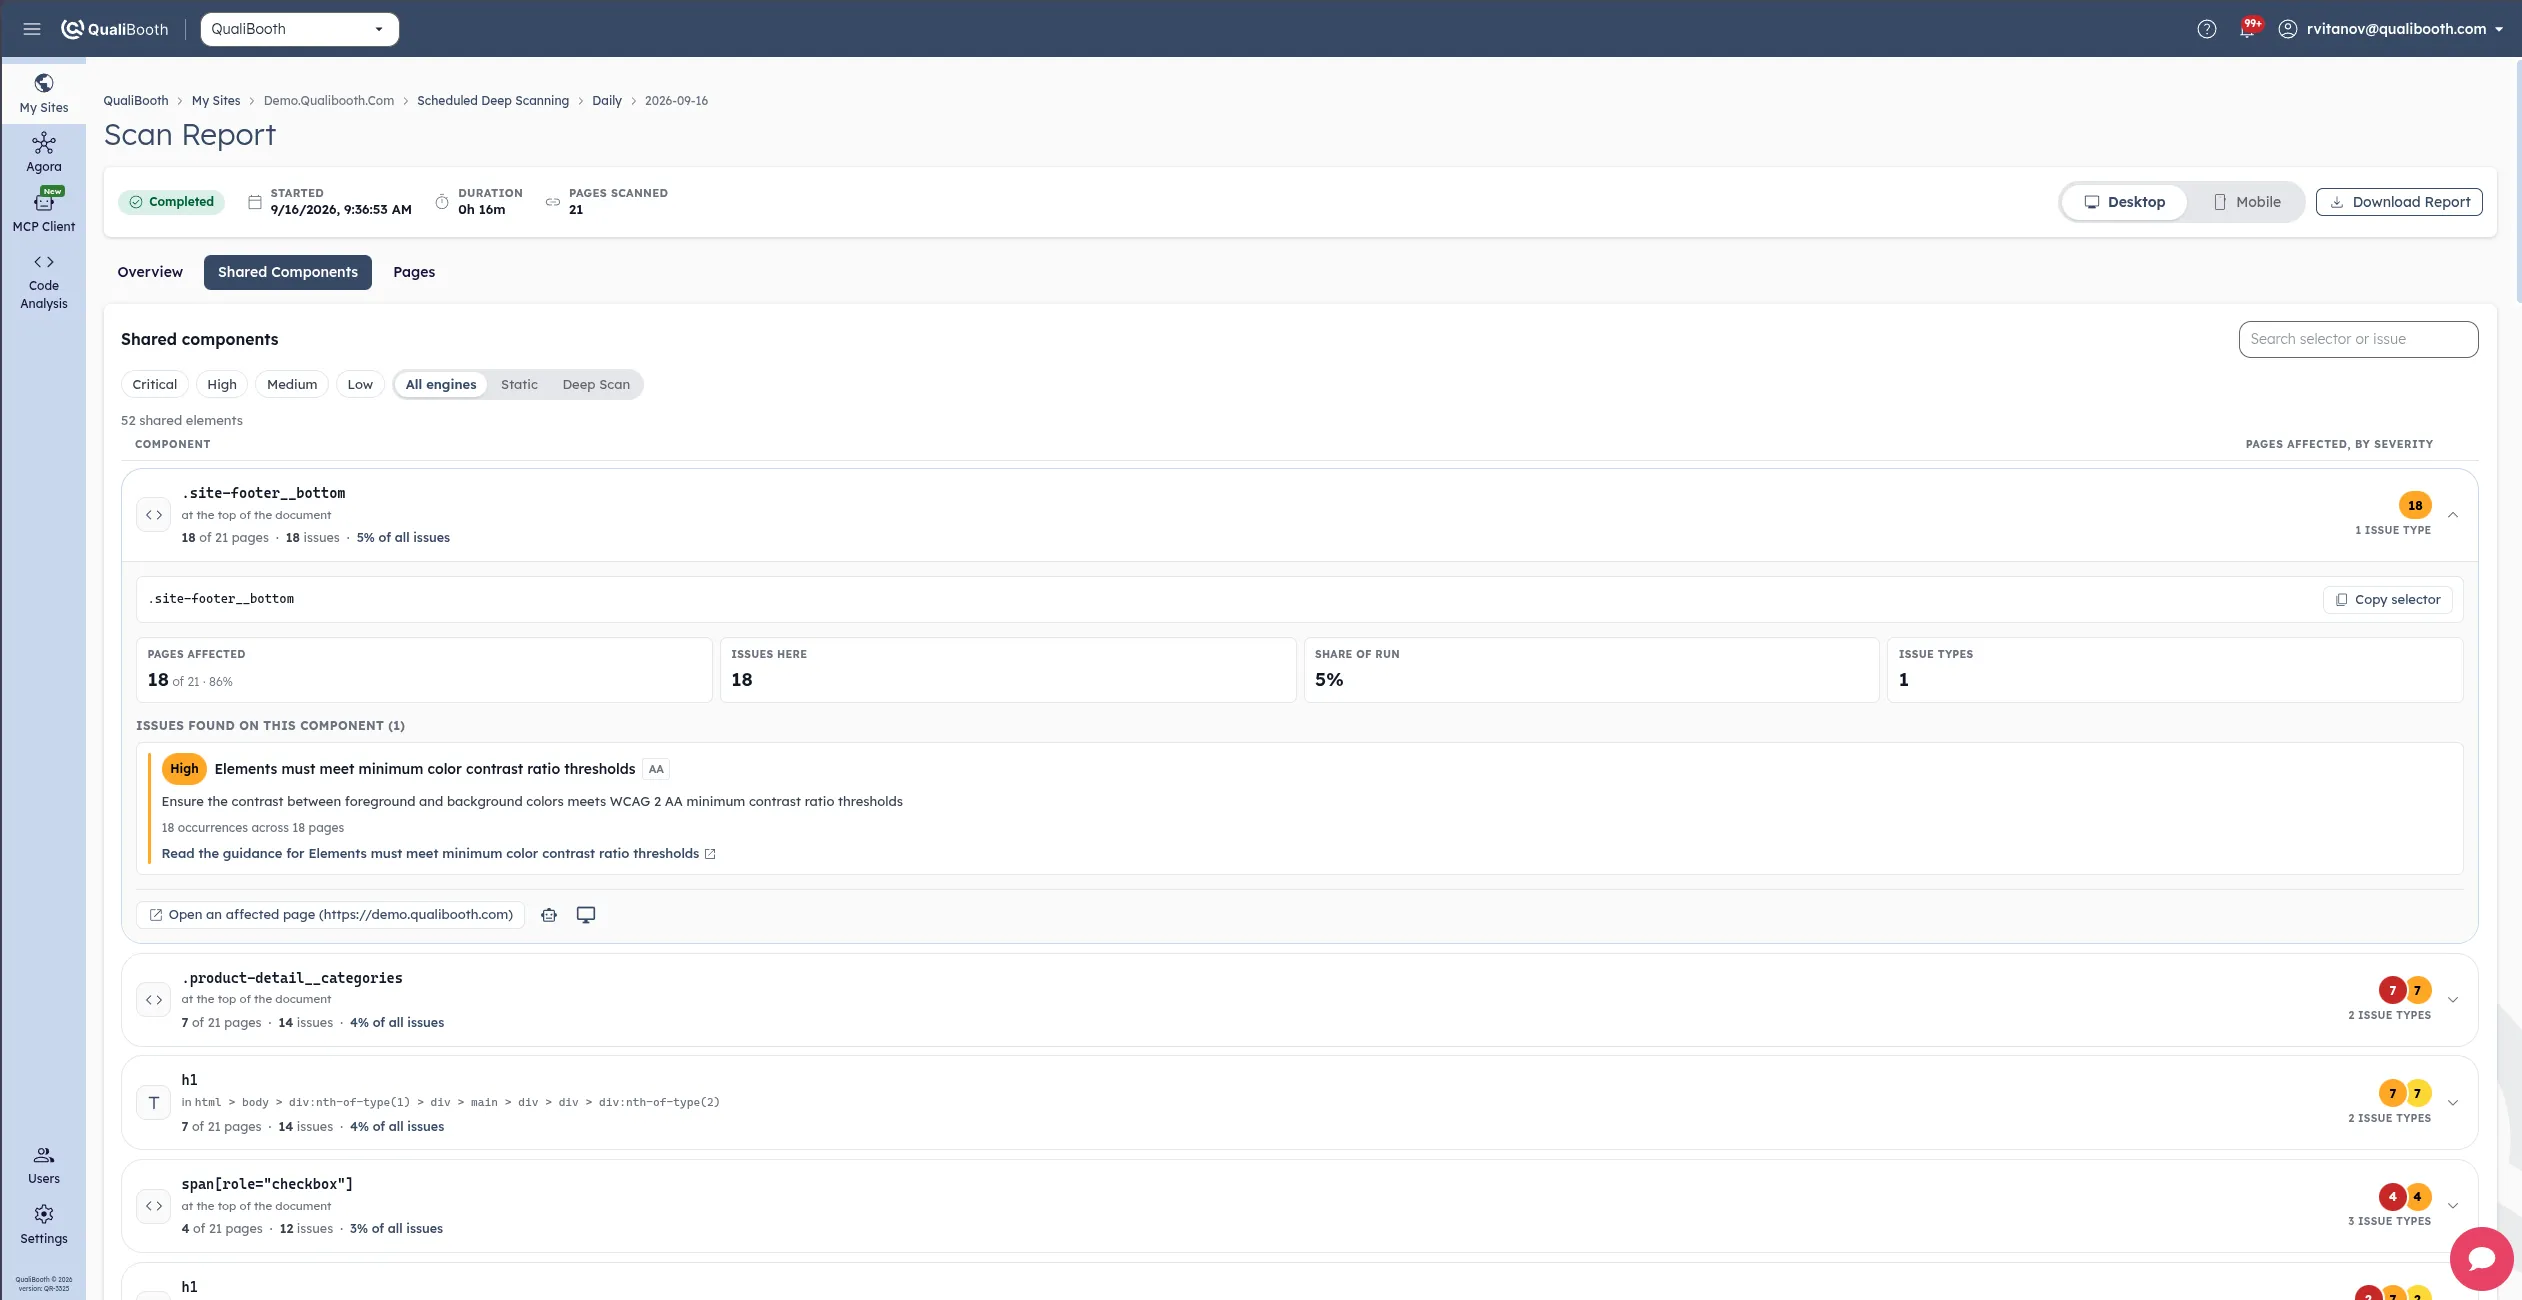
The run report leads with its shared components. The Overview shows how much of the run is fixable at the component level and the three costliest elements; the Shared components tab holds the full list.
- Shared elements and the share of issues fixable at the component level, next to the score.
- A Fix once, fix everywhere panel with the costliest elements, the first one opened.
- A Shared components tab with every element, filterable by severity, engine and text.
- A clear status while a run is in progress, or when no element repeats across pages.
- 1
- row per element, not per issue
- 2
- scan engines grouped together
- 2
- viewports, desktop and mobile
- 0
- setup - included in every plan
Questions we get asked
- What counts as a shared component?
- Any element that fails the same accessibility check on more than one page of a scan run - usually a header, navigation, footer, cookie banner or other templated part of the site. Findings that belong to the whole page rather than one element are grouped too, and listed as Whole page.
- Do I need to set anything up?
- No. Component Grouping runs automatically on every scheduled scan run once it finishes, for both desktop and mobile results. It is included in every plan.
- Does it include Deep Scan findings?
- Yes. Findings from the static engine and from Deep Scan are grouped together, and you can filter the list by engine to see only one of them.
- Does grouping hide any issues?
- No. Every finding is still in the per-page report. Component Grouping is a second view of the same results, organised by the element they are on, and its percentages are always taken against every issue in the run.
- Why is there no grouping for one of my older scan runs?
- Runs that finished before Component Grouping was released are not analysed retroactively. The next scan of that configuration will include it. Grouping also needs at least two pages to scan successfully, since it works by comparing pages.
- How does this help my developers?
- It turns the report into work items that map to your codebase. Each card gives the exact CSS selector to copy, links to an affected page, and opens the live page in the Development Assistant or Agora with the element highlighted - so the fix starts in the component, not in a page-by-page hunt.
See how much of your report is really one fix
Run a free scan, or let us walk you through your site’s shared components in a demo.